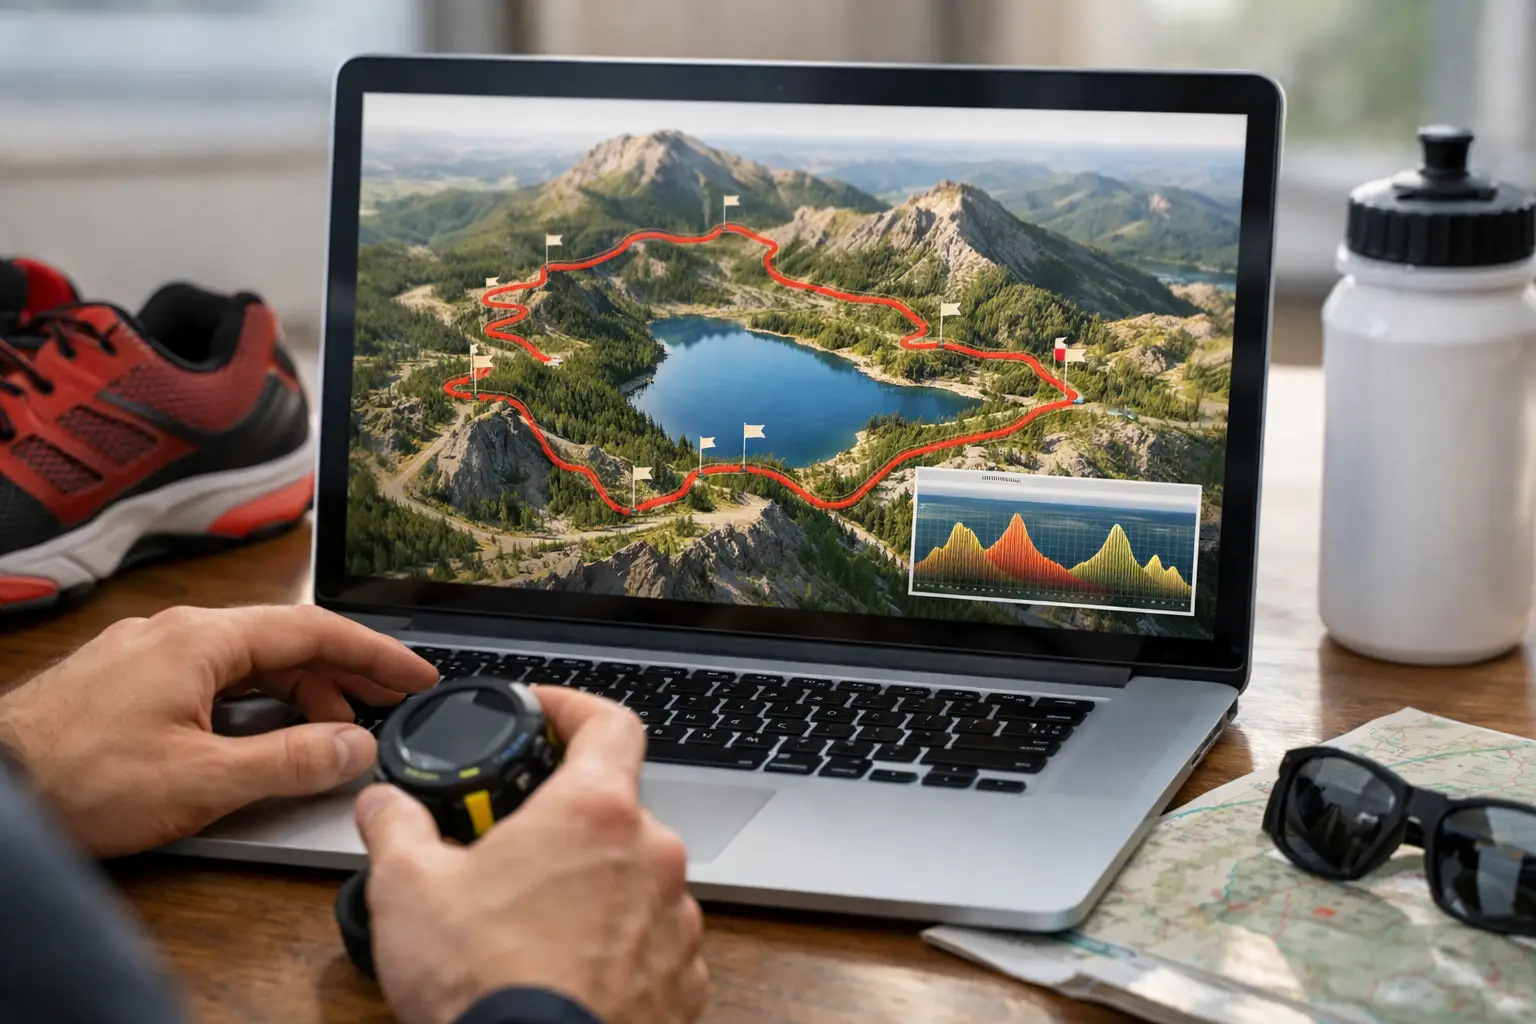
Most runners don’t get in trouble because they’re unfit. They get in trouble because the course turns out different than they pictured. That’s why learning how to use 3d course maps matters. A flat-looking profile can hide a long exposed ridge. A runnable descent can actually be a quad-killing drop. A short gap between aid stations can still be a problem if the section climbs hard and cooks your pace.
A 3D course map gives you something a basic GPX line or static elevation chart can’t: terrain context. It helps you see how the route moves through the landscape, where the course steepens, where it opens up, and where your pacing plan is likely to hold or break. Used right, it becomes a race-prep tool, not just a nice visual.
How to use 3D course maps before race day
Start with the full route, not the details. Your first job is to understand the shape of the day. Look at where the biggest climbs happen, how early they arrive, whether the course stacks vertical gain in one block or spreads it out, and where the major descents sit in relation to aid stations and cutoffs.
This is where a lot of runners make the first mistake. They zoom in too early. They study one switchback section and miss the bigger issue, like a brutal second-half climb after 40 miles of accumulated fatigue. Use the 3D view to get the course narrative first. Ask simple questions. Where does the race demand restraint? Where does it reward efficiency? Where does it punish bad fueling or overpacing?
Once you understand the big picture, rotate the map and inspect the route from multiple angles. One angle might make a climb look moderate. Another reveals how sustained it really is. Looking from different viewpoints helps you judge slope transitions better than a single front-on perspective.
You’re not trying to memorize every turn. You’re building a mental model of the course so race-day terrain feels familiar.
Read the climbs like race segments, not scenery
The most useful way to study a 3D course map is by breaking climbs into race-relevant sections. A climb is rarely just a climb. It may start runnable, then kick up sharply, then flatten before the top. That matters for pacing, heart rate control, poles, and nutrition timing.
Use the 3D view alongside elevation data to identify where the gradient changes. Long steady climbs usually reward patience and consistent output. Stepped climbs with repeated pitches can blow up your legs if you surge each steep section. Short, steep walls might force a power-hike earlier than expected. If you know that before race day, you stop pretending you’ll run the whole thing and start making better decisions.
This is also where race distance changes the answer. In a 20K, you might attack a steep middle climb and recover later. In a 100K, that same move can cost you two aid stations down the line. The map doesn’t make the decision for you, but it shows you where decisions actually matter.
When you review a climb, connect it to what happens after it. A hard ascent before a technical descent creates different fatigue than a hard ascent followed by a smooth fire road. Your pacing should reflect the whole segment, not just the uphill.
Use 3D course maps to judge descents honestly
Runners often underestimate descents because they see “downhill” and think “free speed.” The 3D view is one of the fastest ways to fix that.
Look at how the route drops off a ridge, wraps around a slope, or falls through a narrow drainage. Even before you get into technical details, the terrain shape tells you whether the descent is likely to flow or force control. A long descent with no real breaks can be more damaging than a climb, especially late in an ultra.
Study where the course loses elevation quickly and where it trends down gradually. Those are different pacing environments. Steep descents load the quads, increase footing risk, and can punish aggressive runners early. More moderate descents may be your best chance to move efficiently, eat, and reset.
This is a good place for honesty. If you’re a cautious descender, don’t build your race plan around fantasy split times. If you descend well but fade late, note which downhills come after major climbs. The goal is not to admire the terrain. The goal is to predict how your body will handle it.
Match terrain to aid stations and cutoffs
A strong race plan isn’t built on mileage alone. It’s built on what happens between aid stations. This is where 3D mapping becomes especially useful.
Look at each aid-station-to-aid-station segment and ask what kind of work it demands. Ten miles on rolling trail is not the same as ten miles with a steep exposed climb and a technical descent. A 3D map helps you see why two equal distances can produce completely different split times.
This matters for hydration, calories, and cutoff management. If a section climbs hard out of an aid station, you may need to leave with more fluid than the distance alone suggests. If the route trends downhill into the next stop, you may be able to move faster and fuel on the go. If a cutoff sits after a slow technical segment, you need to respect that section early, not scramble later.
Runners who miss cutoffs are often reacting too late. They realize a segment is slower than expected only after they’re already behind. Studying the course in 3D helps you spot those trap sections before the gun goes off.
Use the map to plan effort, not just pace
On trail, pace is conditional. Grade, footing, altitude, heat, and fatigue can all wreck a pace target that looked fine on paper. That’s why effort planning usually works better than trying to hold one fixed number.
As you review the 3D course map, identify where controlled effort matters most. Early climbs are usually places to cap intensity. Long exposed traverses might require more conservative hydration timing. Technical descents often call for focus over speed. Smooth runnable valleys may be the places to settle in and regain rhythm.
If you use watch-based alerts or pace bands, build them around terrain logic. Don’t expect road-style consistency. A better plan is to assign purpose to each section: hold back here, fuel here, hike early here, run by feel here, push if you still have it here.
That approach tends to survive race-day conditions better because it reflects what the trail actually asks for.
Pair the 3D view with GPX and course data
The map is strongest when it’s part of a larger prep system. Use it with GPX files, elevation analysis, waypoint data, and aid station details. The 3D view shows shape and context. The GPX helps with navigation and device sync. Elevation charts quantify the gain and loss. Waypoints and aid station data turn visuals into decisions.
For example, a climb might look manageable in 3D until you see how long it really lasts. Or a descent might seem brutal until waypoint data shows a flatter break halfway down. Good prep comes from combining those signals.
This is where a platform like TrailSight fits naturally for serious racers. Instead of piecing together screenshots, race websites, and guesswork, you can inspect the route, review terrain transitions, match them to aid stations, and export the files you’ll actually use.
What 3D course maps can’t tell you
They’re powerful, but they’re not magic. A 3D map won’t fully show footing quality, mud, loose rock, heat exposure at a given time of day, or how crowded a singletrack climb feels in the first hour. It also won’t tell you how your legs will respond at mile 70.
That doesn’t reduce its value. It just means you should use it for what it does best: terrain awareness, segment planning, and expectation control.
If possible, combine map review with race reports, official course notes, and your own training context. A steep climb means one thing if you live at altitude and train with poles. It means something else if you’re coming from flat ground and racing heat for the first time. The right read is always personal.
A simple way to study any course map
If you want a clean process, run through the course in four passes. First, study the full route shape. Second, inspect major climbs and descents. Third, review aid-station-to-aid-station segments. Fourth, connect all of that to your pacing, fueling, and watch setup.
That doesn’t take forever. It just takes intention. Twenty focused minutes with a good 3D course map can save you from hours of bad assumptions.
The point of race prep is not to predict every mile perfectly. It’s to remove avoidable surprises. When you know where the course turns hard, where the terrain opens up, and where split expectations need to change, you show up calmer and race sharper. Know the trail before you run it, and the course stops feeling like a threat and starts feeling like a plan.